For those whose drawings were important in their childhood; lines, colors, papers and their smell were the way to observe, imagine, dream, design the experience of the world. If not, go and look for pens or brushes and try again whatever moment you are in your life.
During the childhood of astronomy, humans started looking and drawing what they saw in the sky. Throughout history we have used all kinds of media to generate our experience and knowledgement outside the Earth planet.
And of course, early astronomers created drawings of Mars as if they walked clumsy with foggy visions through rudimentary apparatuses.
Christian Huygens, for example, observed Mars in August 1672 for the second time. His sketches included a dark pattern, a spot made with his hands, that is recognizable to modern observers as Syrtis Major.
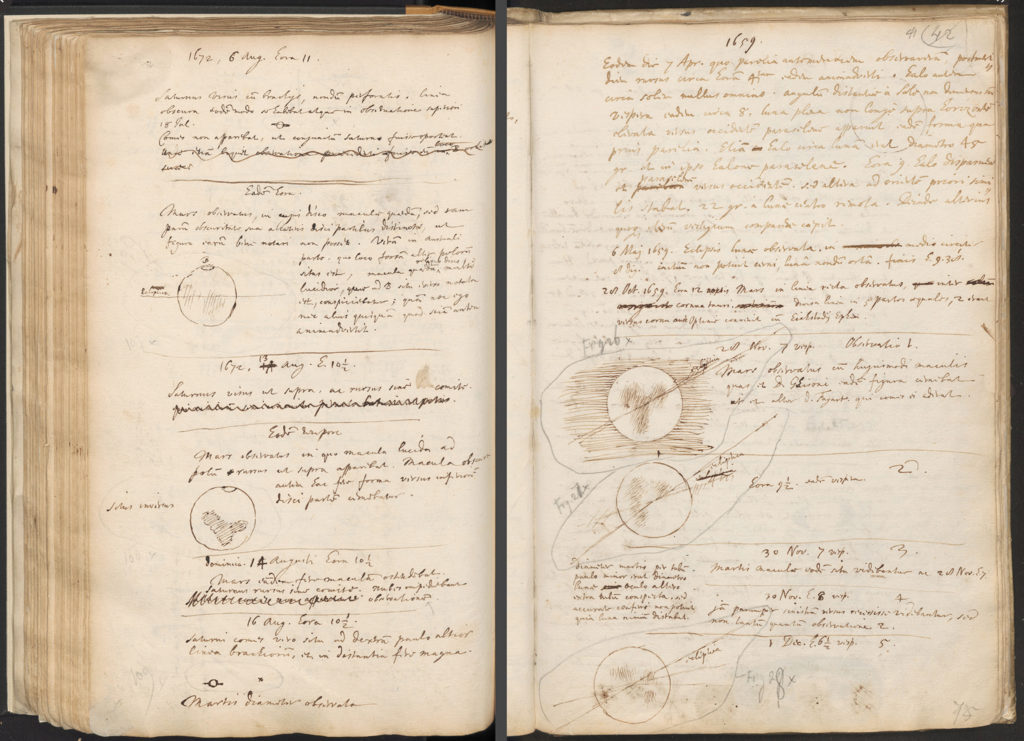
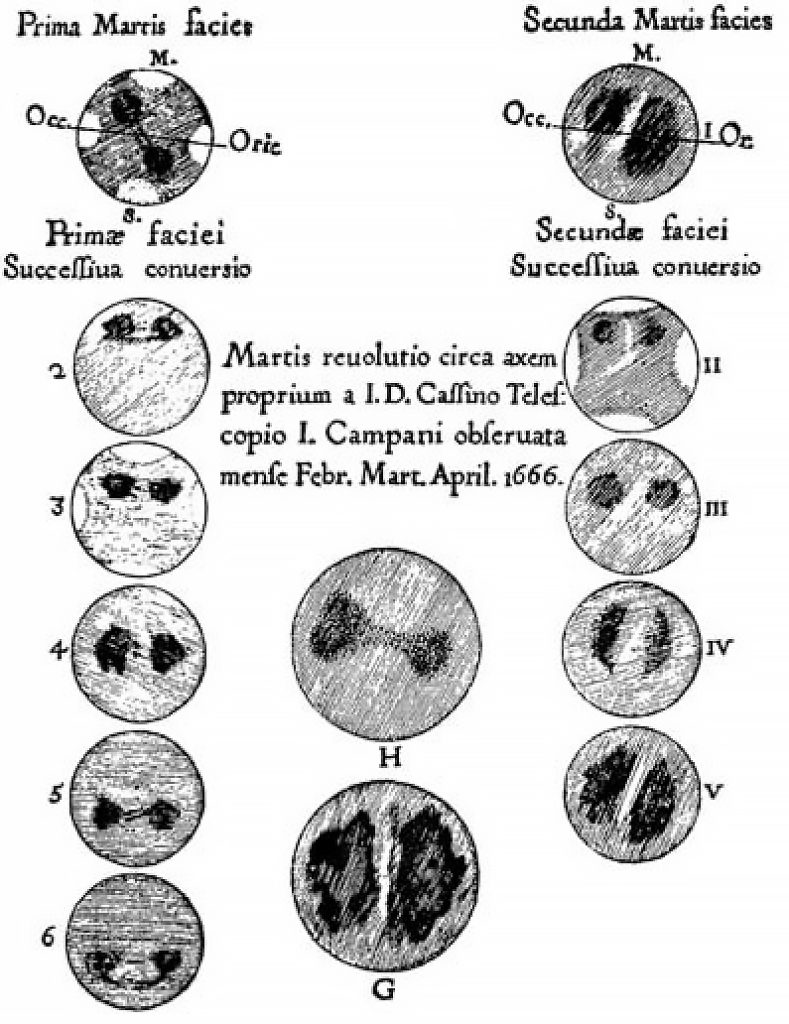
Also Giovanni Domenico Cassini (1625-1712) at the Panzano Observatory in Bologna made several observations of Mars in the spring of 1666. His drawings are the first to show bright white patches that vaguely resemble the icy polar caps. Cassini also determined that Mars rotated once every 24 hours 40 minutes!, an improvement over Huygens’ estimate early.
And the great William Herschel (1738-1822) who had many opportunities to observe Mars in 1783. Using impressive reflecting telescopes at that time, Herschel noted and measured Mars’s axial tilt and he looked for signs of a martian atmosphere. By 1784, Herschel reported to the Royal Society in a touching rapture of conscience:
“The analogy between Mars and the earth is, perhaps, by far the greatest in the whole solar system. The diurnal motion is nearly the same; the obliquity of their respective ecliptics, on which the seasons depend, not very different; of all the superior planets the distance of Mars from the sun is by far the nearest alike to that of the earth…. If, then, we find that the globe we inhabit has its polar regions frozen and covered with mountains of ice and snow, that only partly melt when alternately exposed to the sun, I may well be permitted to surmise that the same causes may probably have the same effect on the globe of Mars; that the bright polar spots are owing to the vivid reflection of light from frozen regions; and that the reduction of those spots is to be ascribed to their being exposed to the sun.”

Drawings and later photographs taken through telescopes, expanded our visions and conscience over time by means of increasing apparatus quality… always looking at the sky earth-boundly.
But something new and different happened in the XX century, during the 60’s more precisely. Spaceships started arriving near Mars and we saw the planet closely. The first successful ship was the Mariner 4, in 1965.
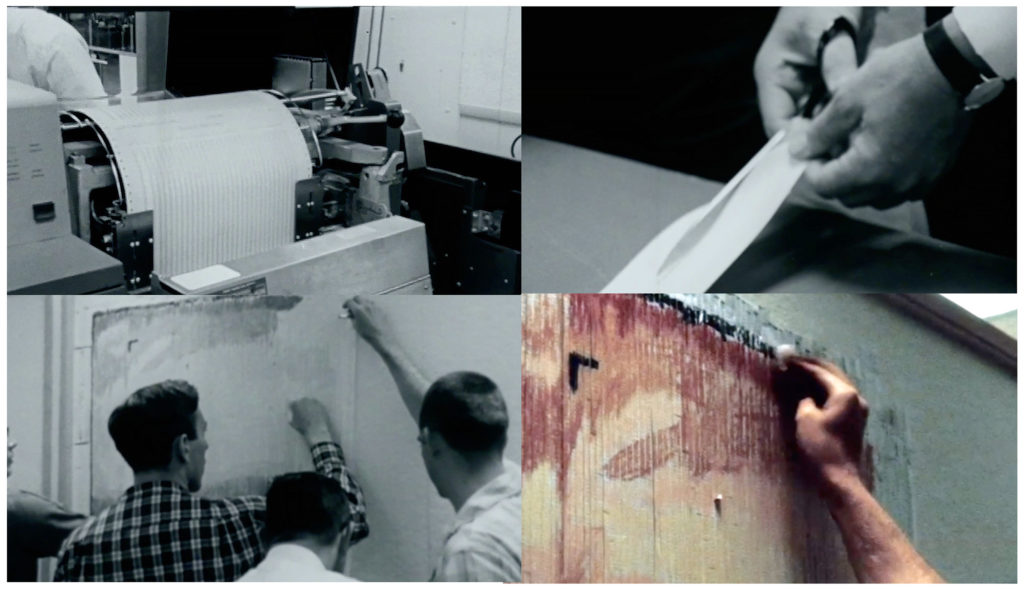
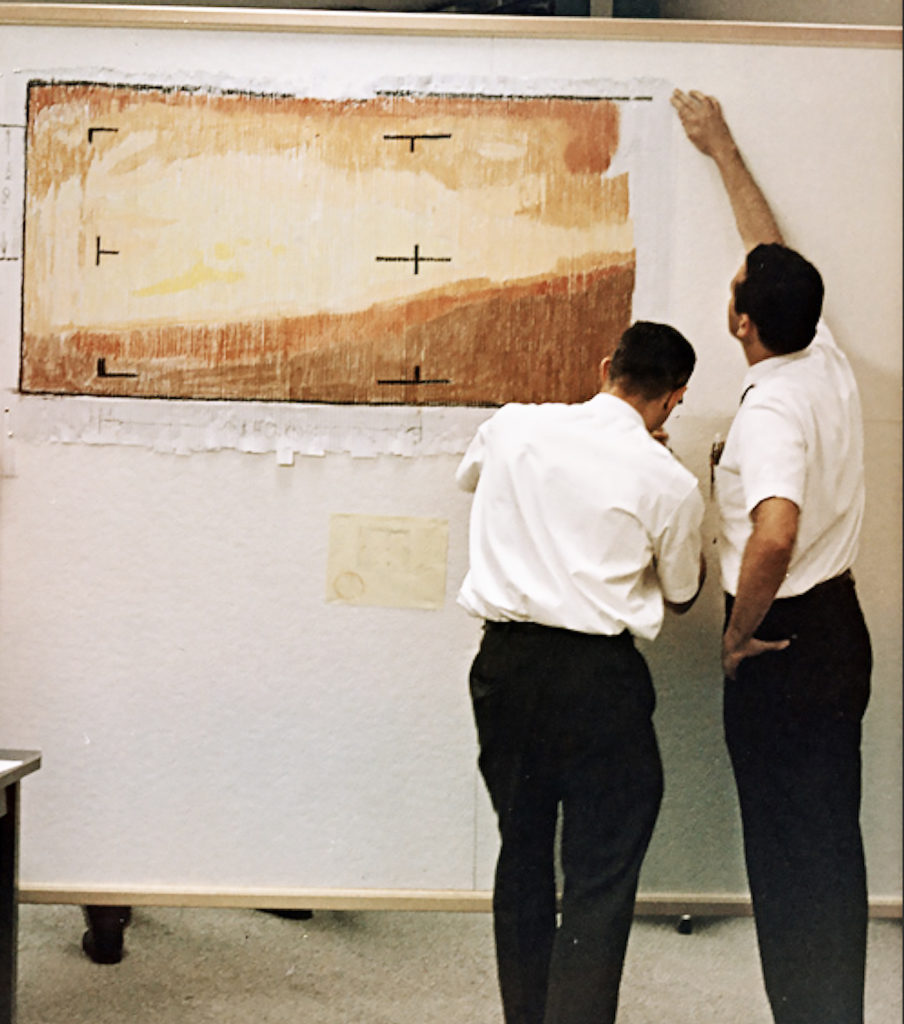
Scientists were so excited when they realized the Mariner 4 camera was working, that they couldn’t wait the few hours it would take for the completed image to be processed. Instead, they tried to interpret the photo’s metadata: reams of numbers generated from the real-time data translator machine. These strips of code were pinned together on the wall, while staff from the Telecommunications Section at Nasa’s Jet Propulsion Laboratory rushed out to buy pastels. A color key was devised and staff filled in the code by hand like a “painting by numbers” exercise until an image gradually emerged from lines of numbers. When the actual photo eventually emerged, the hand-drawn image was proved correct, with the planet itself at the top left and the sky below.
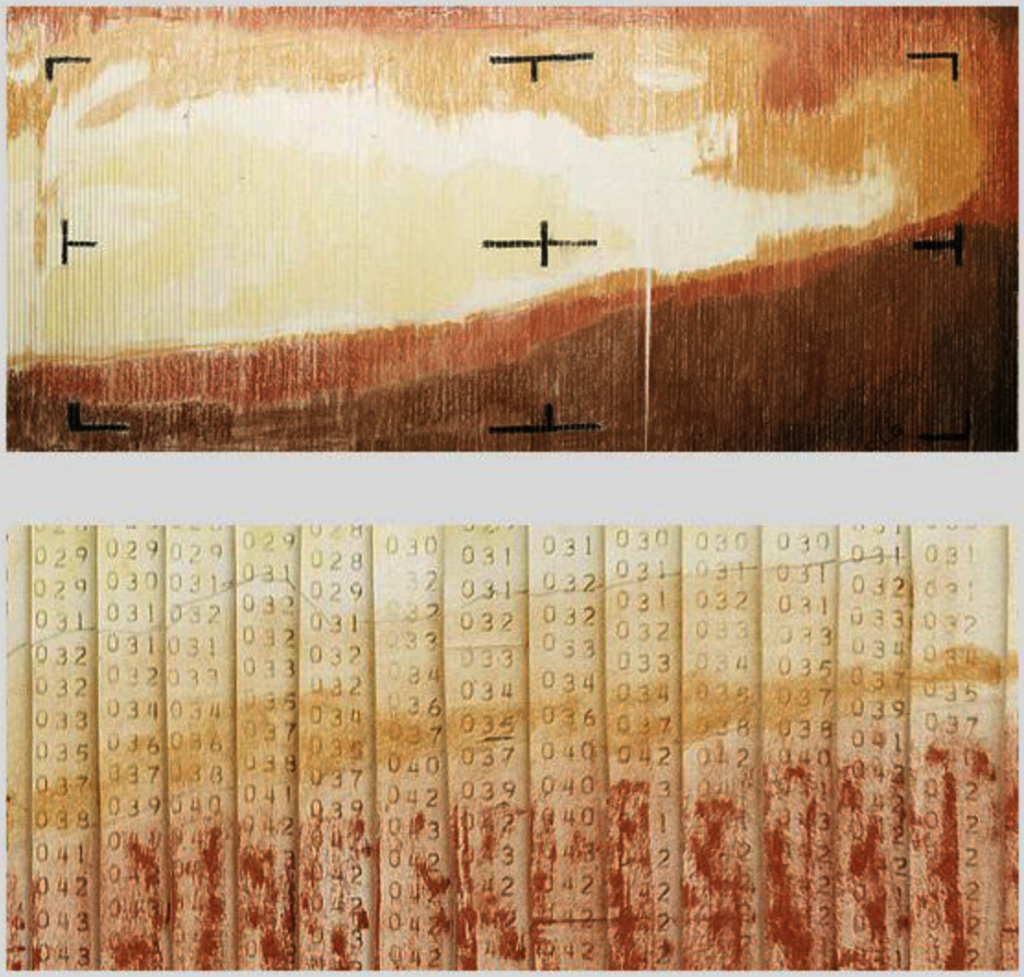
The root of data visualization has to do with interpretations of numbers and the materialization of images (even sound) through numbers by intuited and arranged visual elements. Since then, we have drawn time and time again images of Mars by interpreting numbers despite the technologies involved in the process.
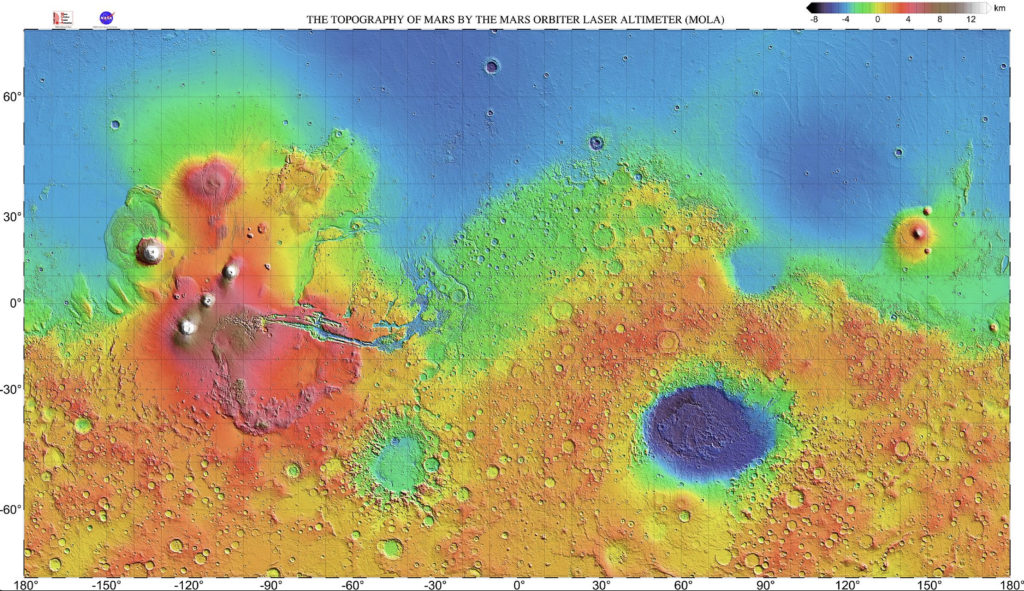
Recently, a shaded relief map of Mars was created with data from the Mars Global Surveyor’s laser altimeter (MOLA) collected between 1997 and 2001. During that time, the spacecraft measured 671,121,600 laser pulses.
It resulted in an incredibly detailed elevation map of the planet’s surface. And we could have a much more cognition of the altitude dimension of the planet as never experienced before.
With the spirit of returning to the original instance of materializing drawings from data; a wall map is made maintaining the appearance of those maps of school map libraries.
It’s 2,30 x 1,25 meters printed on canvas with traditional altitude colorature as usual in Earth-like maps.
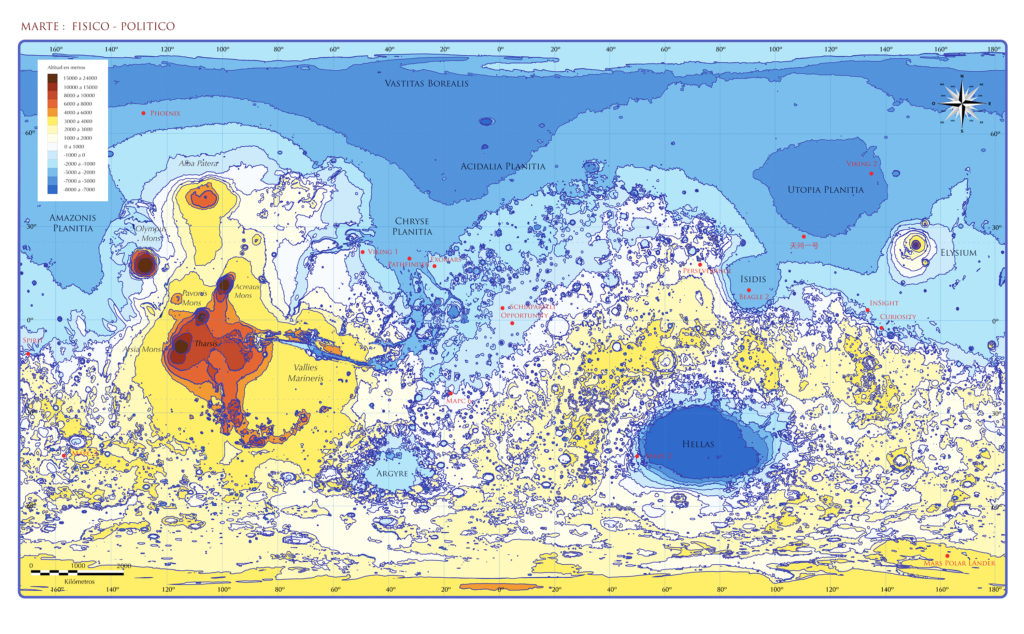
The most marked characteristic of the map is that of making explicit to the viewer the range of altitudes of Mars, which is extreme for us.
Altitudes range from aprox 22 Km high at Olympus Mons volcano, which is the highest point on the planet and the largest known volcano in the solar system, to – 7,2 Km deep in Hellas Planitia.
Mars has no Oceans, therefore the zero level depends on what kind of details you want to express with data information. Nevertheless zero level height on Mars is defined as the equipotential surface whose average value at the equator is equal to 3396.2 km ordinarily.
Think on Earth; we have Mount Everest’s peak, the highest altitude of 8,848 meters, and The Marianas Trench located in the Mariana Islands; the deepest oceanic trench on Earth where maximum known depth is 10,984 meters. Mars has a total difference in altitudes of around 30 Km against 19 Km our Earth’s.
From drawings through telescopes to orbiter laser altimeter data humans have traveled along their discoveries and ways to tell the world. Despite the complexity of such processes, still remains our initial childhood gesture to trace our universe, raising awareness of it, creating it.
Hi, this is a comment.
To get started with moderating, editing, and deleting comments, please visit the Comments screen in the dashboard.
Commenter avatars come from Gravatar.