“On Rigor in Science“
. . . In that Empire, the Art of Cartography reached such Perfection that the map of one Province alone took up the whole of a City, and the map of the empire, the whole of a Province. In time, those Unconscionable Maps did not satisfy and the Colleges of Cartographers set up a Map of the Empire which had the size of the Empire itself and coincided with it point by point. Less Addicted to the Study of Cartography, Succeeding Generations understood that this Widespread Map was Useless and not without Impiety they abandoned it to the Inclemencies of the Sun and of the Winters. In the deserts of the West some mangled Ruins of the Map lasted on, inhabited by Animals and Beggars; in the whole Country there are no other relics of the Disciplines of Geography.
Jorge Luis Borges. Suarez Miranda: Viajes de Varones Prudentes, Book Four, Chapter XLV, Lérida, 1658.
A friend of mine told me something astonishing!. He saw a map where countries were scaled in their actual sizes. He was thrilled because since he was child he had in mind other shapes and proportions of the Earth. Suddenly, he realized some parts of the territories were much smaller than he used to know.
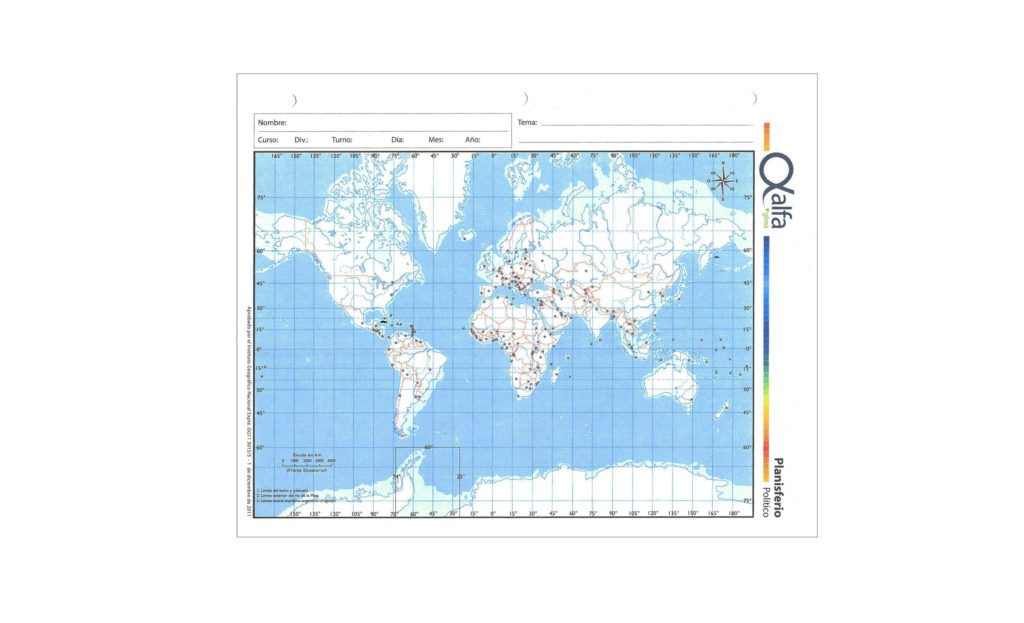
We use maps at school and they model our idea of the world. Our homeworks brought about a close relationship to those special colors, and shapes of our planet. Our childhood school maps created the idea of a planet where Greenland and Antarctica appear far larger than they actually are relative to landmasses near the equator, such as Central Africa.
This is due to the Mercator projection used for representation of the Earth in most school maps. Gerardus Mercator was a cartographer, who created these projections in 1590.
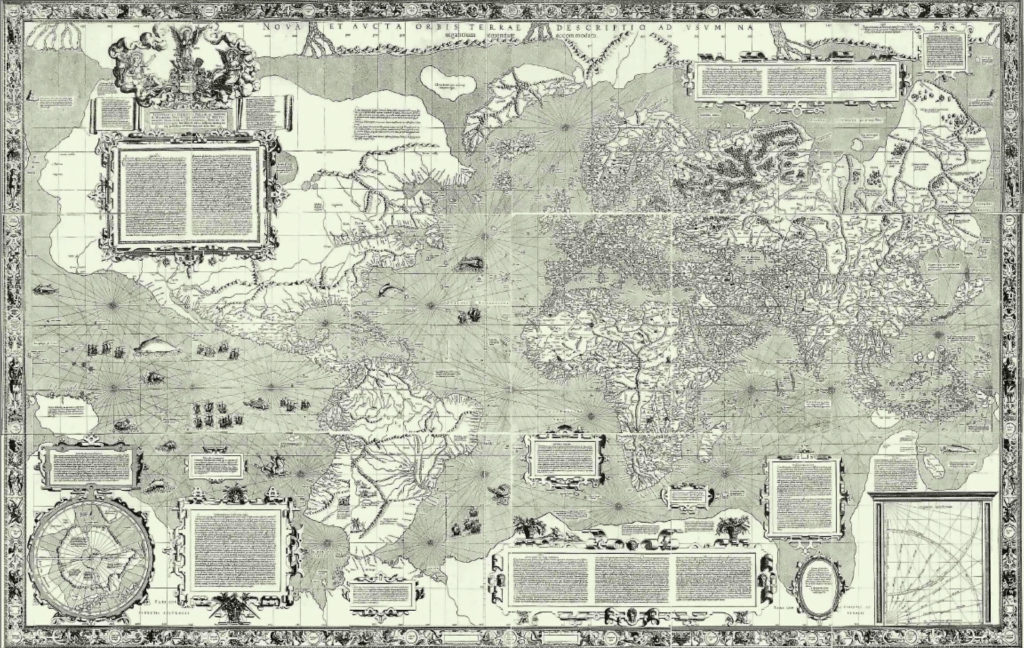
“the foremost mathematician of his time who crafted artistic and accurate globes showing the heaven from the inside and the Earth from the outside …” as can be read in his epitaph.
The Mercator projection inflates the size of objects away from the equator. This inflation is very small near the equator but accelerates with increasing latitude to become infinite at the poles.
If we accept such distortions, why is it so popular ?. The projection has been widely used since the 17th century for nautical charts because it allowed the drawing of constant course or rhumb lines as straight and uninterrupted lines, unlike other more precise projections. Since then, hundreds of generations have grown up with such a particular idea of the globe until now.
Despite Google Earth changing our perception of the planet, and the availability of few alternative map projections in schools; Mercator projections are still the most common way to represent the Earth in the classroom.
To draw a map, is to create a cosmovision of an epoch which is inculcated to people. In most cases people have this image in mind as if it were the only way to think about our planet, having also socio-political consequences. In any case, the kind of reference system used for a map is not taken into account in schools.
Thinking of printing school maps of Mars for children; it would be significant to engage young people with different perspectives and representations. It could contribute to being aware of what is most relevant for a given point of view. To learn that a perspective is circumstantial and not absolute. To know that playing with variations of the forms according to a particular reference system, could be an extremely creative exercise that goes beyond the construction or reading of a map.
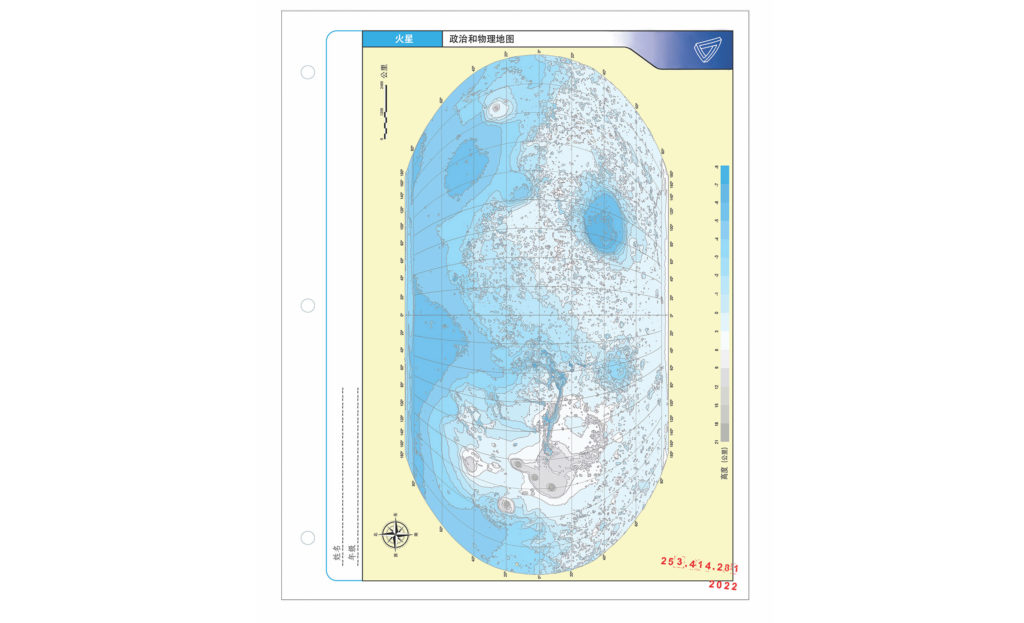
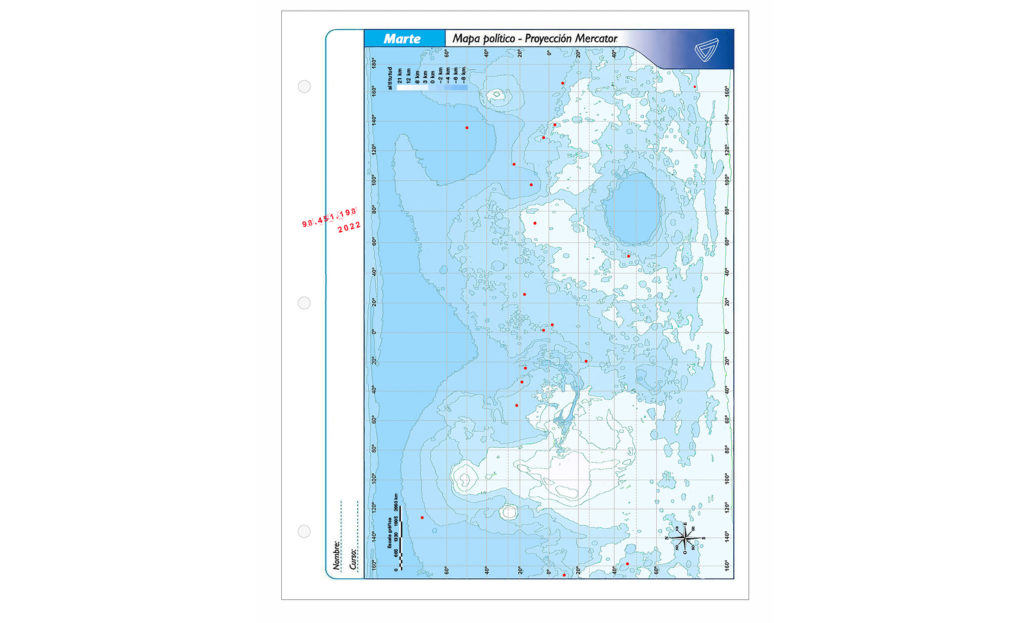
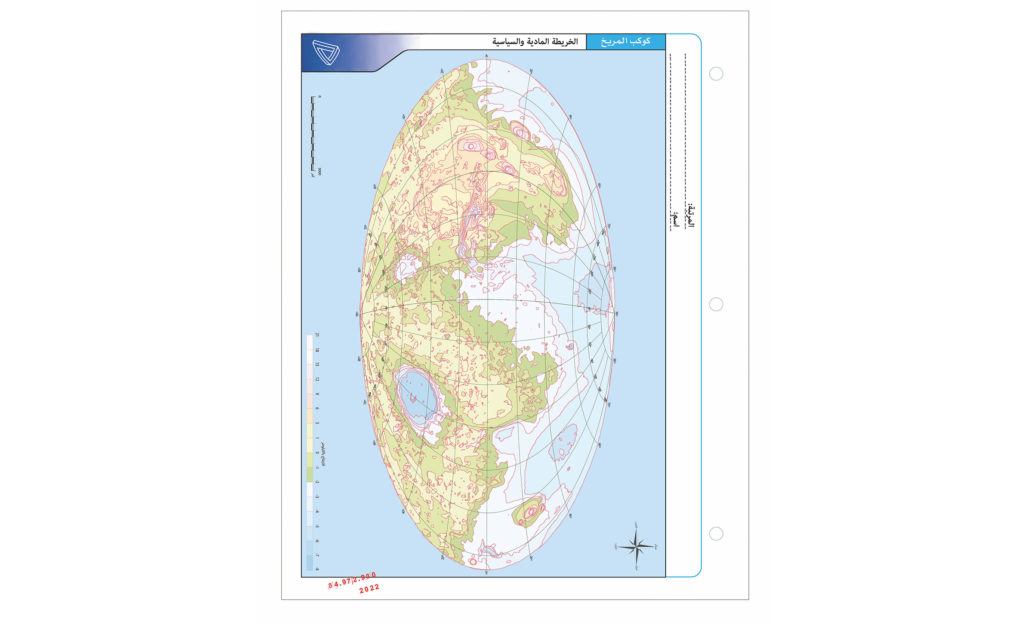
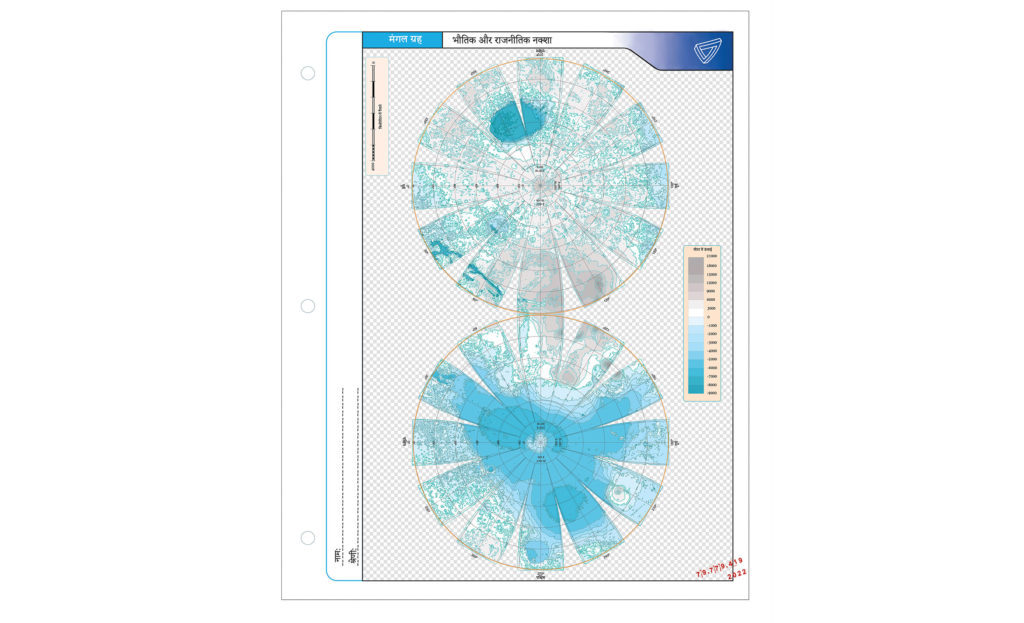
The printed series of Martian maps “One Map of Each Child of the World” are written in different languages and numbered. However, how many maps correspond for each language?
Let’s estimate it: According to Unicef , the total population of the world in 2022 is 7,953,952,577 people.
There are 678,215,031 children under age 5. And a scholar population under 18 years old of approximately 1,697,434,445.
https://data.unicef.org/how-many/how-many-children-are-in-the-world/
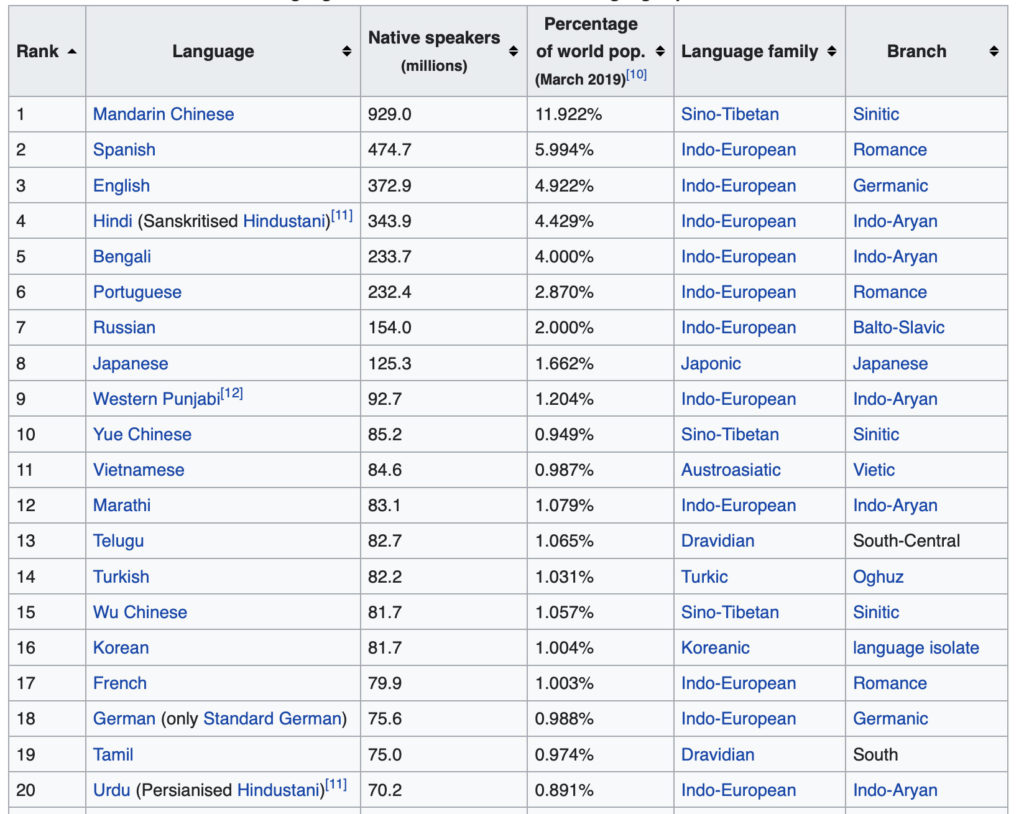
On the other hand, we take the statistics of spoken languages in the world provided by SIL International (Summer Institute of Linguistics), whose the first 20 most spoken languages are:
https://en.wikipedia.org/wiki/List_of_languages_by_number_of_native_speakers
After a little math, we estimate the number of maps to be printed for each language.
253,414,281 maps in Mandarin
98,451,198 maps in Spanish.
84,871,722 maps in English

84,972,990 maps in Arabic
79,779,419 maps in Hindi.
And
52,280,981 maps in Portuguese.
51,771,751 maps in Bengali
41,077,913 maps in Russian
31,590,741 maps in Japanese
24,443,056 maps in Punjabi
23,594,339 maps in German
21,217,931 maps in Javanese
20,369,213 maps in Shanghainese
19,690,240 maps in Malay
19,520,496 maps in Telugu
19,350,753 maps in Vietnamese
19,350,620 maps in Korean
19,011,256 maps in French
18,671,779 maps in Marathi
17,992,805 maps in Tamil
16,804,601 maps in Urdu
…
At this point of the list: let’s suppose a Martian orbits around the Earth for a while. This Martian has the capacity to hear humanity speaking all together. What would the martian perceive as the most spoken language?.
In times of big data visualizations (sonification) and AI offsprings, maps remind us that our conception and perception of the world is always related to some specific reference system. That the cosmovisions of a given representation narrates can be different (and it is worth it) as soon as we change the references and perspectives.
In this sense, Instead of building that Borgean map strictly equal to the territory, let’s try to cover the world with billions of maps of Mars for each child. Perhaps not just for drawing cartographic ephemerides on the 2D map, but to expand the dimensions of it to much more than 2D by writing their own and intimate stories. Then and only then, maybe the map would be equivalent to the territory.
Two final comments:
*Martian Language is an unconventional representation of Chinese characters online. So 火星文 in Chinese is 吙☆魰 in Martian Language. In 2007, Martian language began to catch on in mainland China. The first adopters of Martian language mainly consisted of Post-90s netizens. The Martian language became so popular in cyberspace that even some pieces of software were created to translate between Chinese and Martian language.
https://en.wikipedia.org/wiki/Martian_language
** The Italian-American Physicist Fermi, who created the world’s first nuclear reactor, expressed the conflict between the lack of clear, obvious evidence for extraterrestrial life and various high estimates for their existence. He writes in a 2015 article , “If life is so easy, someone from somewhere must have come calling by now.”